
2022 Restaurant Trend Report
For the first time since COVID, restaurants in 2022 enjoyed a full year of things being back to normal. Or as close as they will be for a while.
Rising costs and staffing shortages, plus the looming threat of recession, have spelled a recovery less convincing than many hoped for in the dark days of 2020. Still, restaurants made it work. The last few years have demonstrated just how important restaurants are to the dining public, and that support spells a bright future in the long run.
To shed light on how the industry changed this year, BentoBox has gathered critical data from our 14,000+ worldwide restaurant partners. Here are a few of the trends that defined 2022.
Cost Pressures
When restaurateurs remember this year, one word will probably spring to mind: inflation. Though diners came back in droves, restaurants spent most of the year struggling to meet that demand amid rising costs in both food and labor.
Cost pressures rose across the board.
Percent of Restaurants Reporting Cost Increases Since 2020¹
|
|
|
|
|


Restaurant prices rose less than their costs.
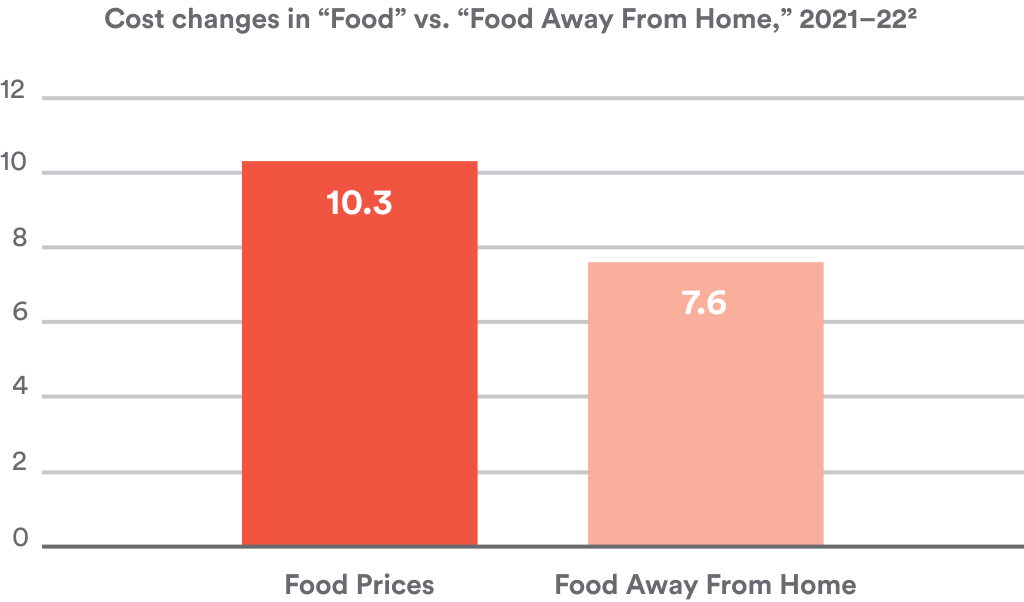
This year, the industry’s already-thin margins got even thinner. Restaurants raised menu prices, but it wasn’t enough to account for inflation on their food costs.
91% of restaurants increased prices this year, but 85% still report being less profitable than pre-pandemic.³
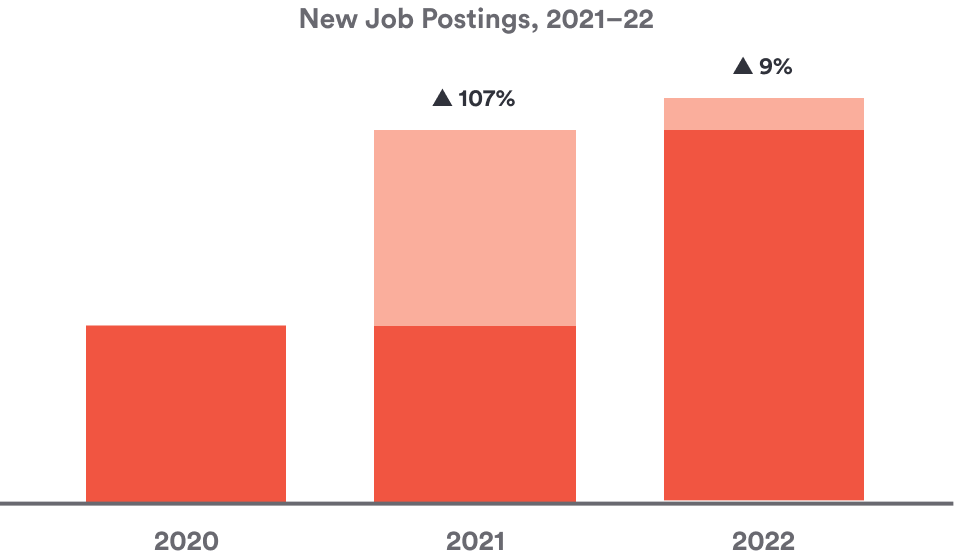
Workers were hard to find.
The restaurant industry found itself short-handed again this year. After job posts on BentoBox websites doubled last year, 2022 saw a second straight annual increase in recruitment efforts.
Worker wages have increased by 21% since 2020⁴, but 65% of restaurants still lack the employees to meet customer demand.⁵

Restaurant Technology
Hesitant to pass soaring costs on to their customers, restaurants searched for ways to capture higher-margin revenue in 2022. Online technology helped: Restaurants that used email marketing and direct e-commerce were able to tap into repeat business with low acquisition costs.
Technology is helping restaurants address current challenges.
52%
of restaurants have employed new technology to address labor gaps.⁶
24%
of restaurants have employed new technology to address rising costs.⁷
 Revenue from loyalty program promotions increased 74%In total, repeat customers accounted for 35% of online orders — up from 29% in 2021. |  Revenue from automated emails increased 8%When restaurants started sending automated email promotions, total online orders increased by an average of 11% per week. |  Revenue from digital gift cards increased 9%The average online gift card sold for $120, but diners redeemed just 73% of that amount ($89). Restaurants kept the difference. |
Diners felt good about the abundance of restaurant tech, with 71% saying it made their guest experience better.⁸
“For a long time in the restaurant business, technology was largely ignored until it came time to change the point-of-sale system. That has changed dramatically in recent years as consumer habits shifted and companies more desperate to find customers and employees turned to technology with increasing gusto.”
Jonathan Maze⁹
Editor-in-Chief, Restaurant Business
September 2022

Diner Discovery
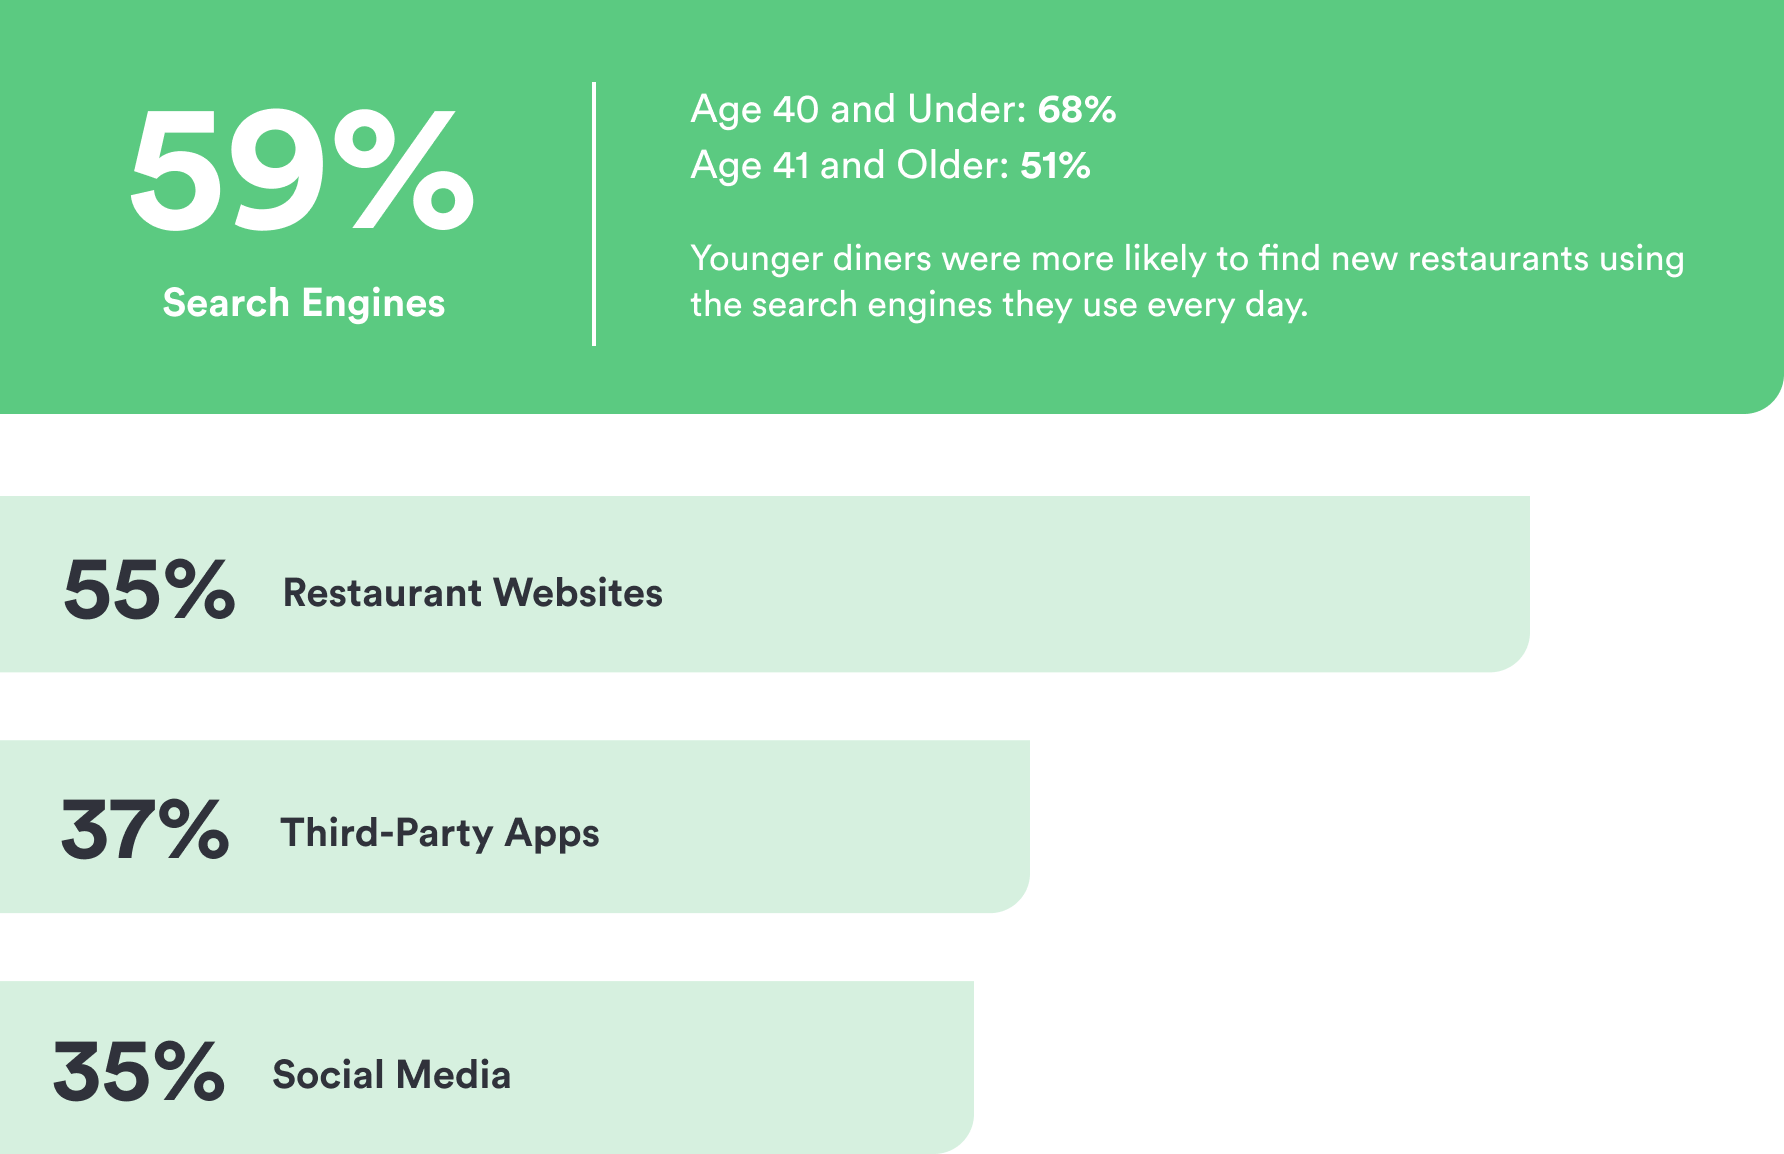
When a diner checked out a new restaurant in 2022, there was a 75% chance their journey passed through the restaurant’s website. Why? Because diners preferred to discover new restaurants using search engines — which connect customers to restaurant websites — more than any other channel this year.
Diner Discovery in 2022

Search Engines and Websites were the top two channels for finding new restaurants, outpacing Social Media and Third-Party Apps.
Nearly half of adult diners did not use third-party reservation platforms to discover new restaurants.
Google Maps drove more restaurant discovery than any other review platform in the industry.
Diners Discovered New Restaurants Using:
Search Terms Varied by Age Group
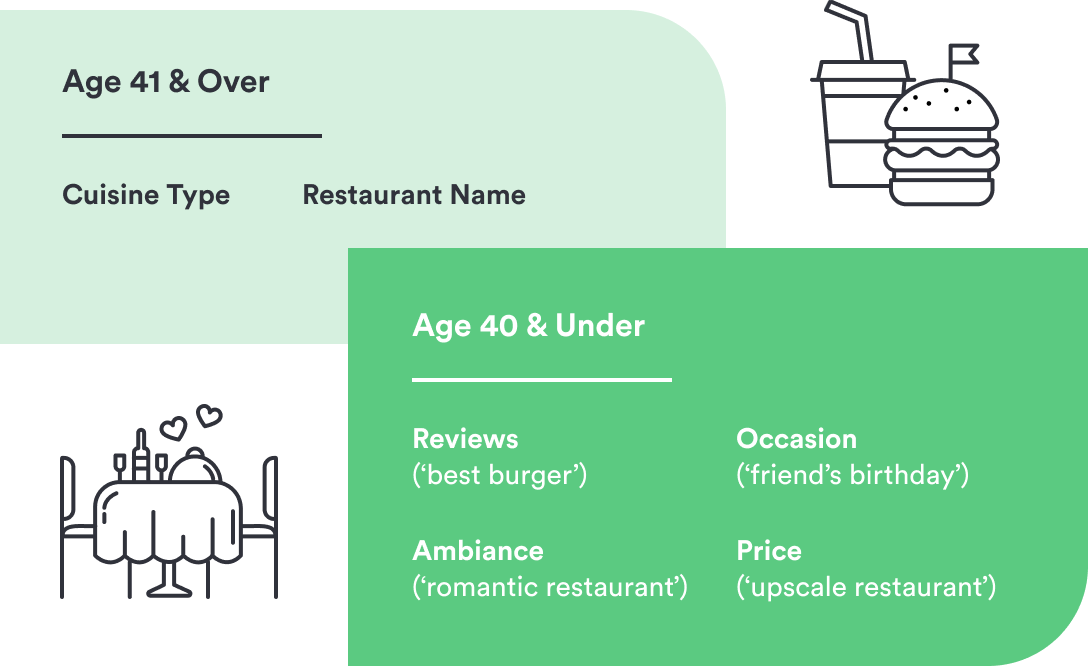
Older diners tended to search for restaurants with a clear idea of what they wanted.
Younger diners were more flexible, favoring open-ended search queries that guided them to restaurants that met their needs.
The restaurants that attracted these diners were the ones with great SEO and a strong media presence.
One in twenty visitors
to BentoBox restaurant home pages placed orders or made reservations.

Online Ordering
During the pandemic, online ordering became an emergency lifeline even for restaurants that had never offered it before. In 2022, online ordering proved it had staying power. Diners continue to place orders, and restaurants continue to encourage higher-margin ordering through their websites instead of marketplaces.
BentoBox Online Ordering in 2022
18% increasein restaurants offering direct online ordering | $33 million+saved on third-party fees through online ordering¹⁰ | 38% increasein revenue per online catering order |
Snapshot: The Changing Habits of Ordering Online
As takeout and delivery become more integrated into daily life, customers are changing when they decide to treat themselves to an ordered meal.
Online Ordering Flattened Across the Week…
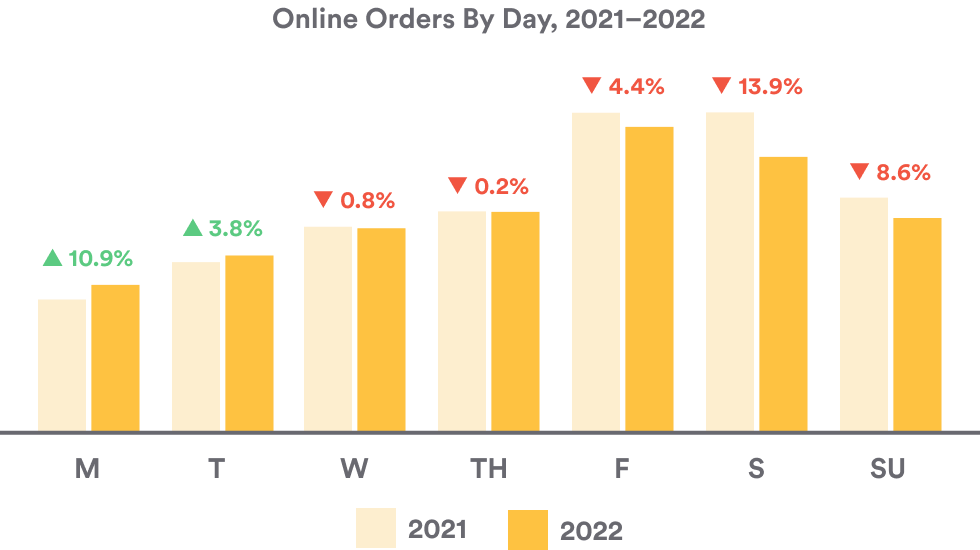
Online ordering volume has always grown with the work week. However, this behavior is slowly becoming more balanced, with early weekday ordering becoming more common.
… And Across Mealtimes.
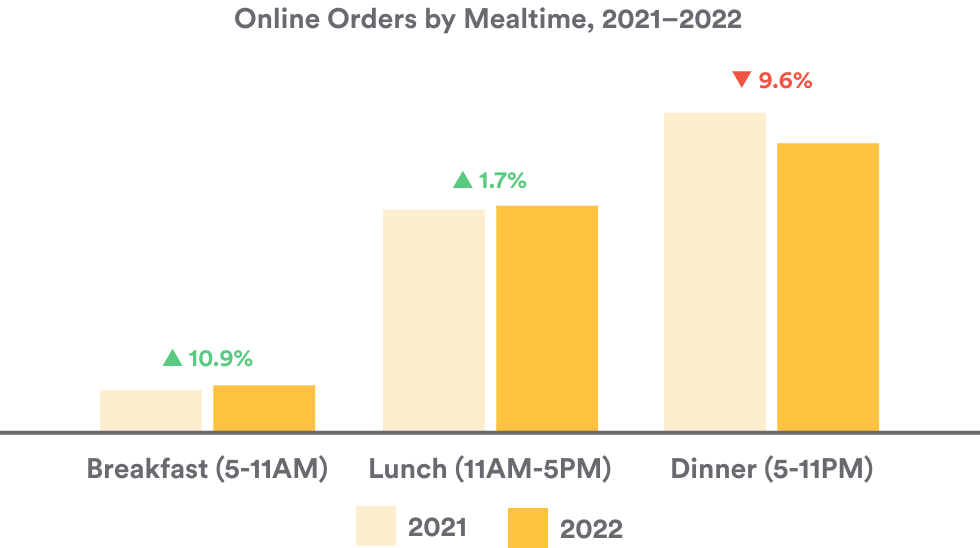
The same shift flattening order volume across days is happening within days, too. While dinner is still clearly the most popular meal to order online, dinner orders decreased while breakfast and lunch orders increased.
Snapshot: The United States of Tipping
Think tipping is the same everywhere? Think again. Only nine in ten delivery orders received a tip, and the size of those tips varied quite a bit.
Percent of Orders Receiving a Tip
88%Delivery | 63%Pickup |
Average Tip Amount (Pickup & Delivery)
9.12%2021 | 8.38%2022 |
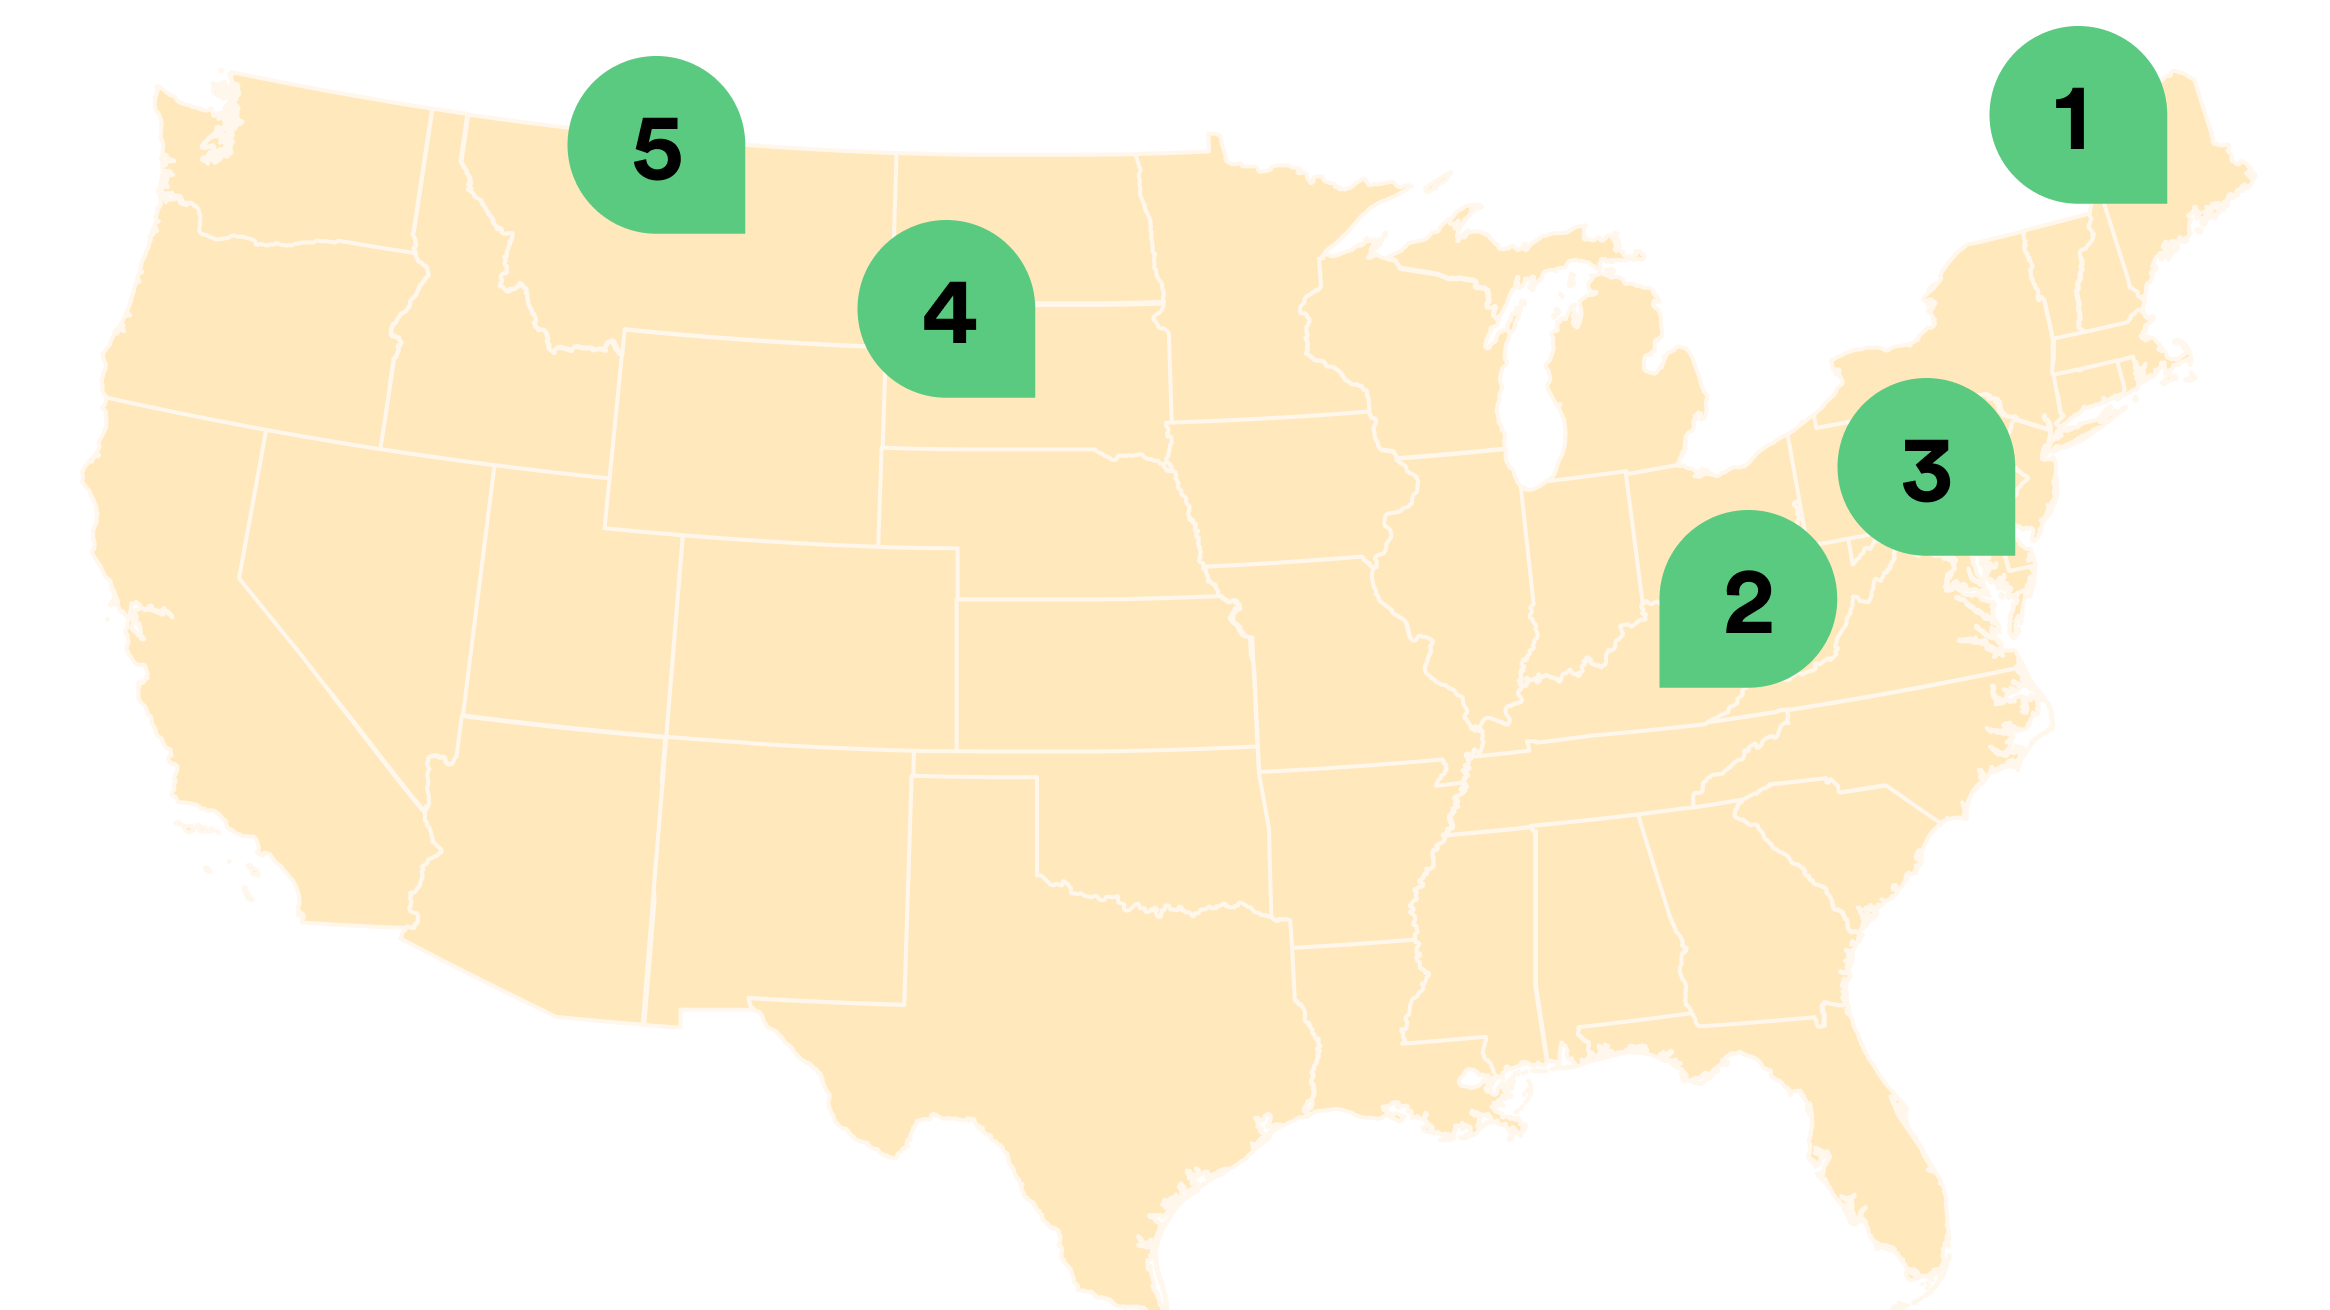
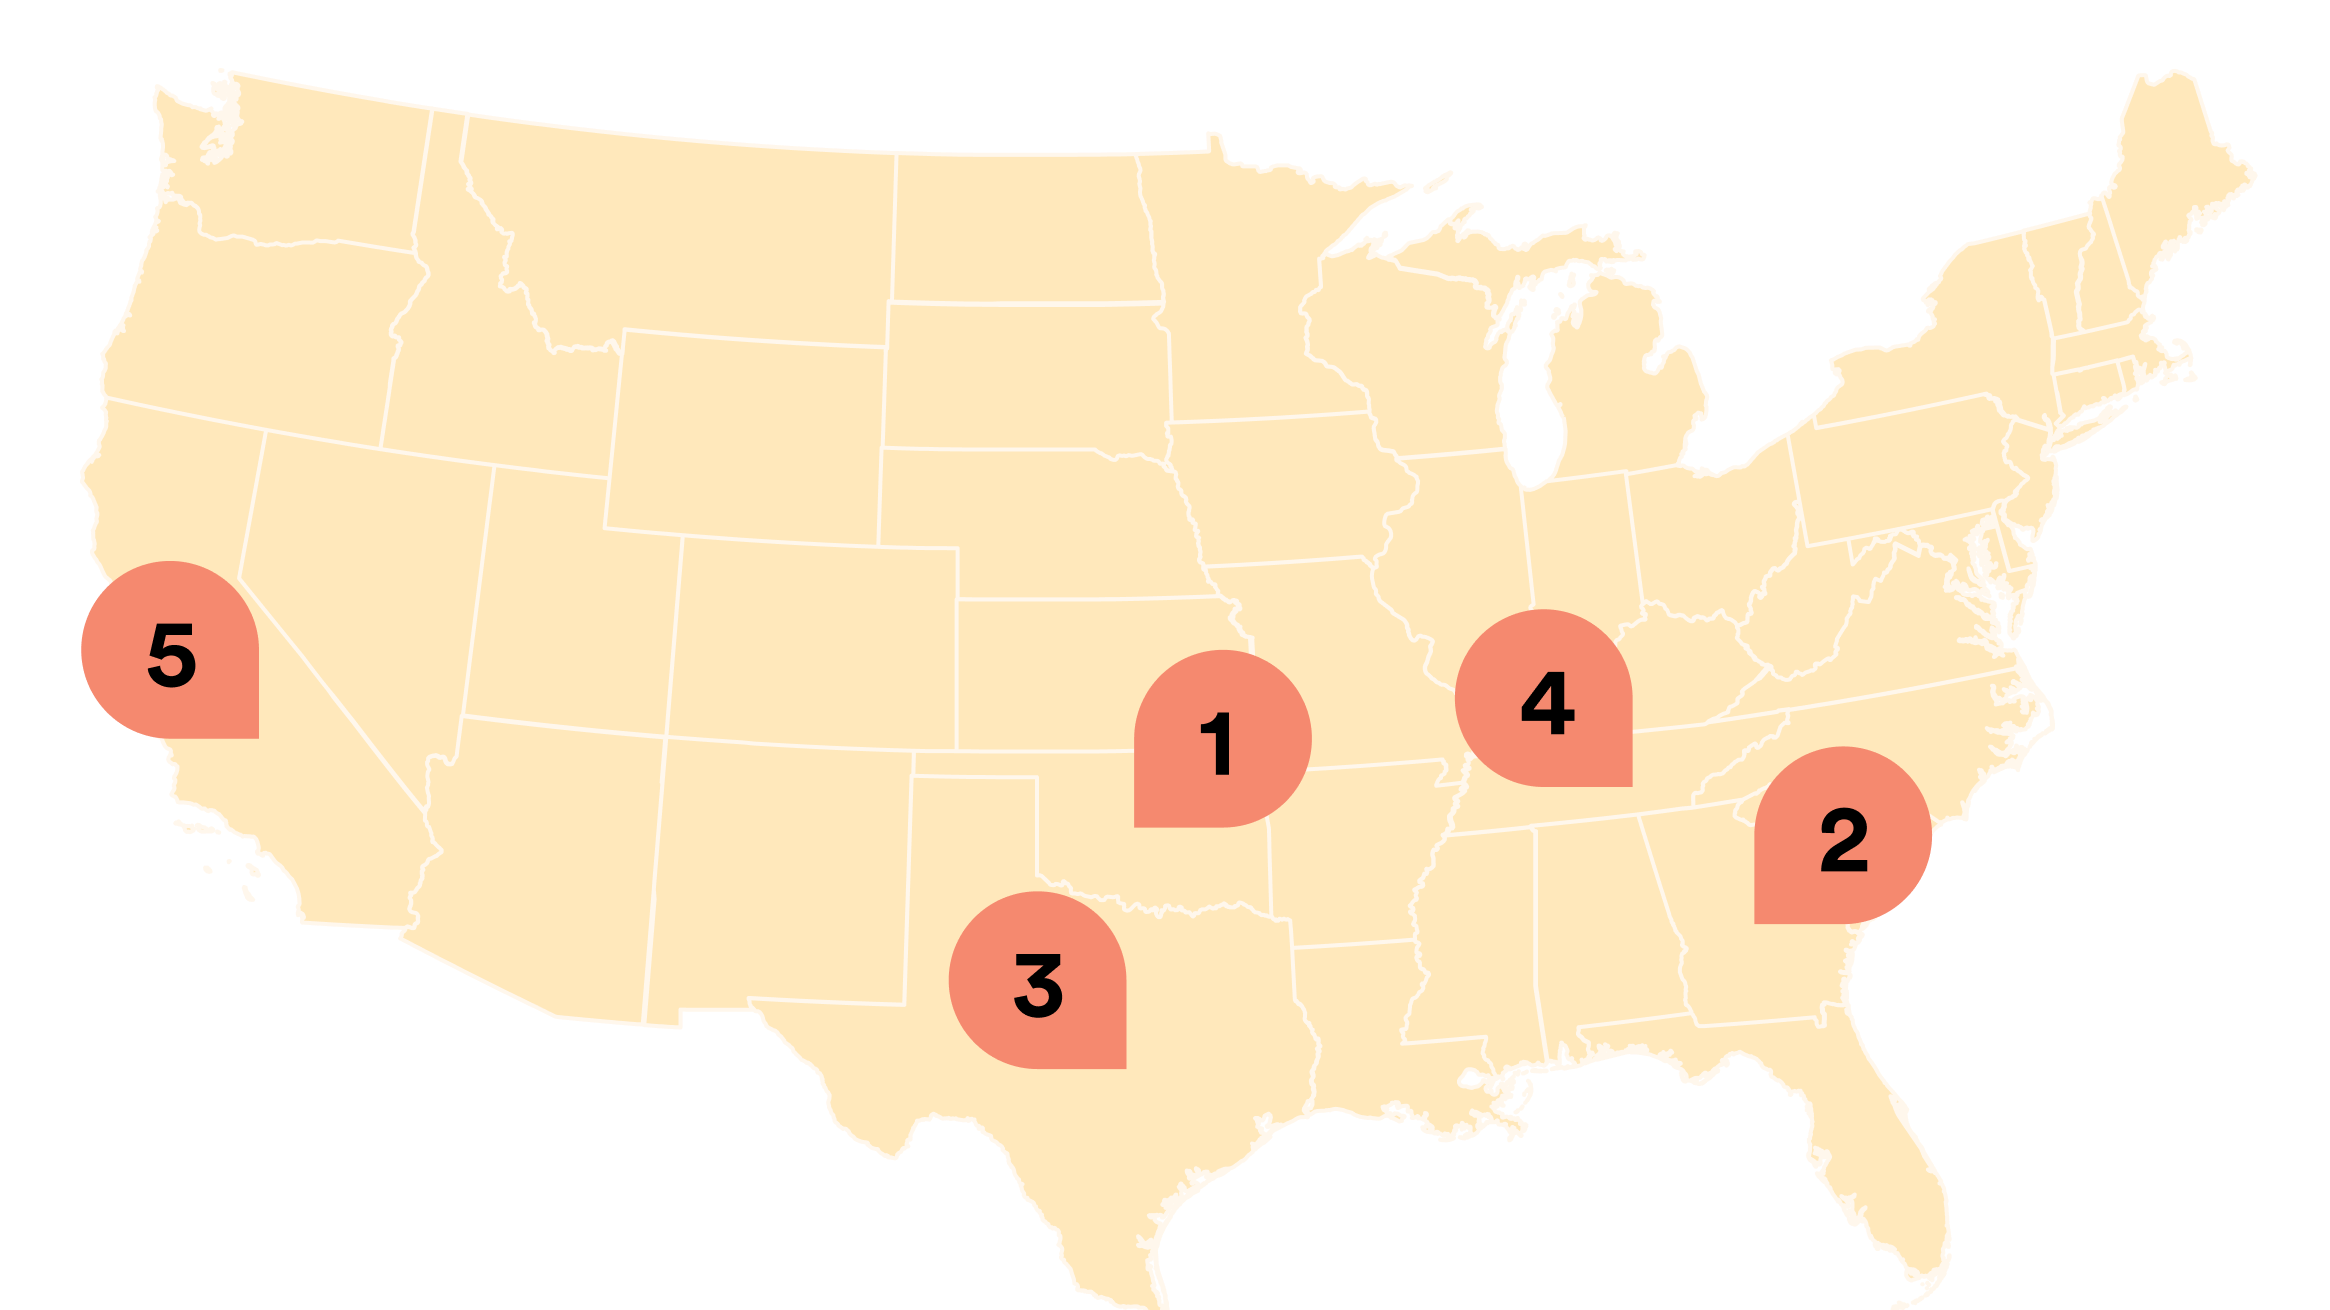
Which States Tip The Best and Worst?
Based on average tip per delivery

In-Person Dining
For all the changes that came to the restaurant industry in 2022, nothing felt nicer than getting back to the business of in-person service. Heading into the second full year of the recovery, operators now have in-person events as yet another revenue channel to lean on as in-person dining demand softens.
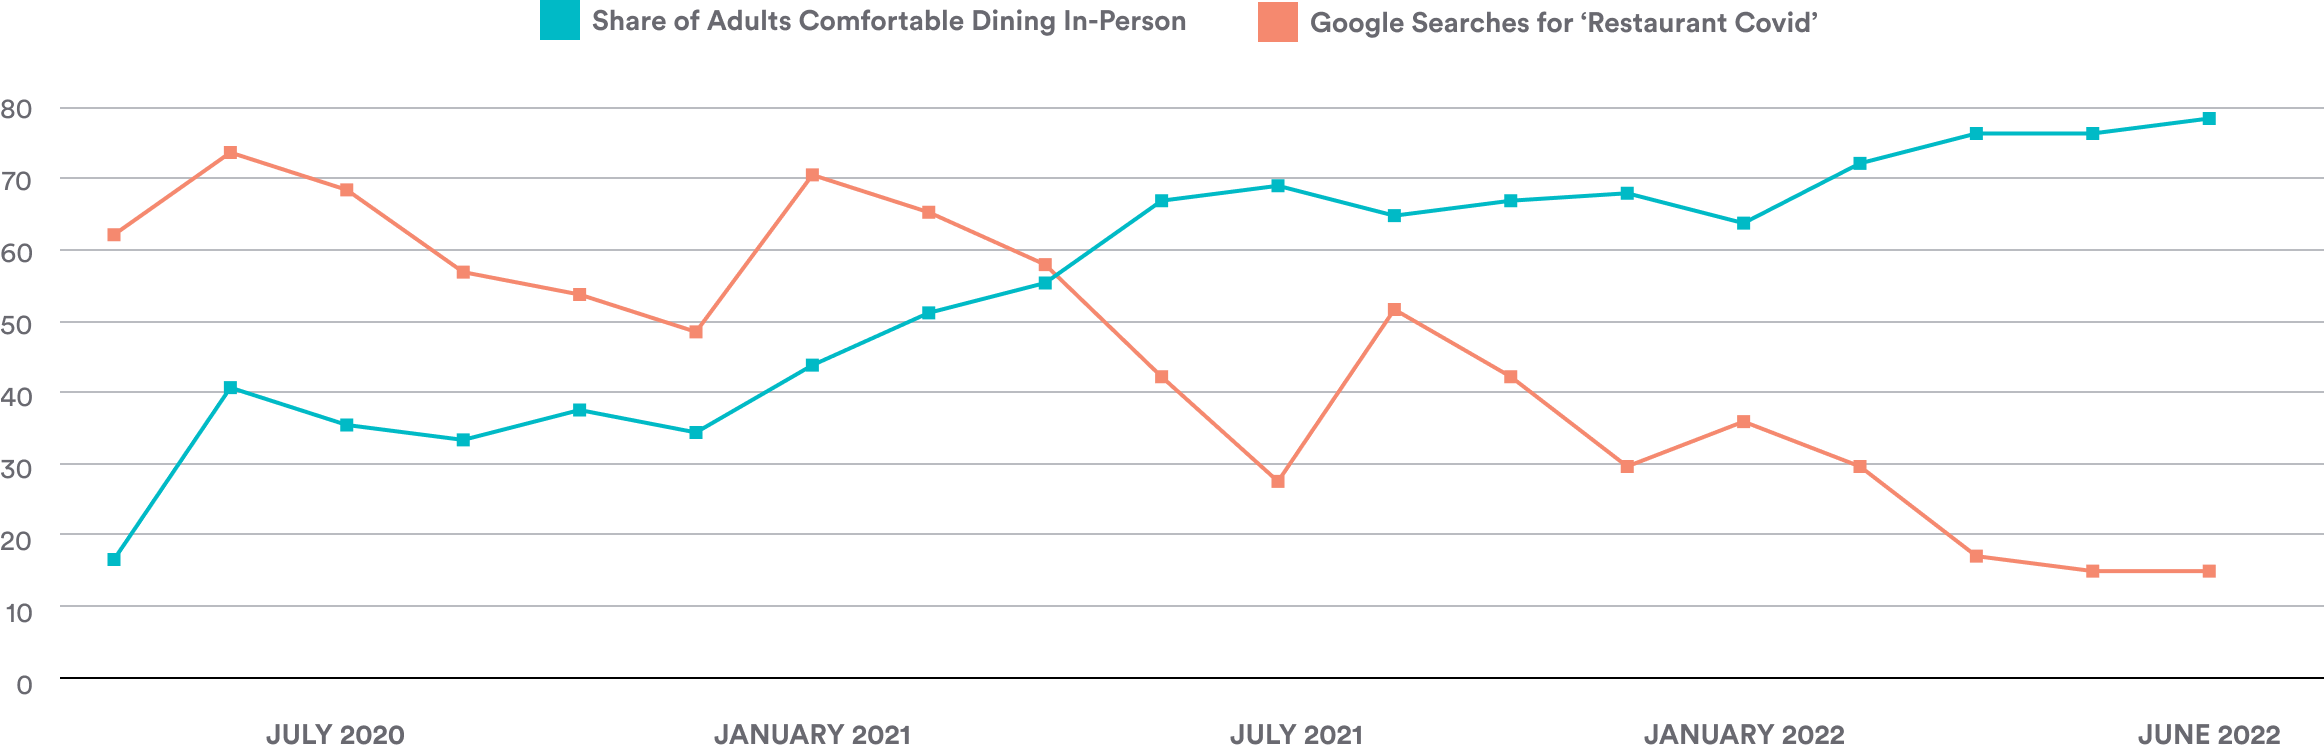
Diners are more comfortable in-person than they’ve been at any point since the pandemic started.¹¹ They’re saying as much in surveys, and they’re showing it with drastically fewer Google searches¹² for “restaurant COVID.”
Transaction data confirms that in 2022, diners entered a new phase of comfort on-premises.

38% increase
in dine-in orders through BentoBox’s Dine-In Order & Pay
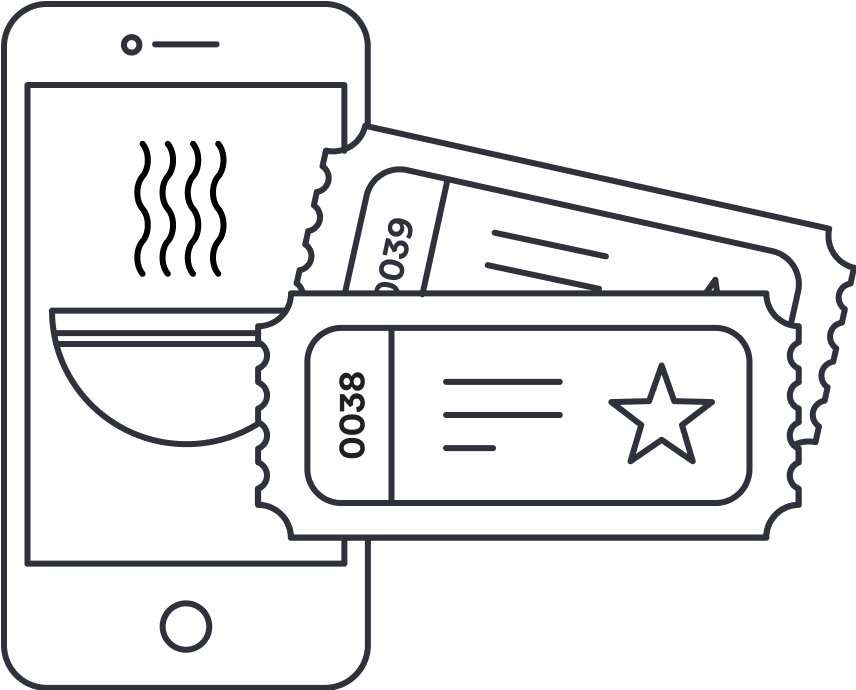
84% increase
in online ticketed event sales

 | EMERGING TRENDS TO WATCH IN 2023 |  |
 | Labor costs will plateau.Towards the end of 2022, labor costs were already beginning to grow at slower and slower rates every month. In 2023, look for wages to become more stable over time — or even come back down to earth. You can still expect to pay an arm and a leg to attract workers, but the period of labor upheaval that began with COVID probably has its most volatile days in the rear-view mirror. |
 | The real post-pandemic period will begin.Even by early 2022, the post-COVID boom in dining showed signs it was running out of steam. In 2023, with fears of recession on the horizon and inflation having the same chilling effect on diners that it does on restaurants, the industry seems headed for the first truly post-pandemic winter in years. Restaurants will meet the challenge by proceeding with lower headcounts and reduced menus & service. |
 | More restaurants will offer (periodic) online-only service.In 2022 and 2021, a lot of restaurants had to shorten their hours of operation due to staffing shortages. But with online ordering channels set up in more restaurants than ever, many of those restaurants in the future will opt to stay open for online orders only instead of closing altogether. Online orders are easier on the back-of-house than in-person service, meaning even a short-handed staff can still take orders and drive revenue. |
 | Non-alcoholic beverages are ready for prime time.Zero-ABV drinks have exploded in popularity over the last few years. Sales of “NA” products were up 24% in 2022, on top of robust growth in previous years.¹³ These drinks are especially popular among younger diners and in metropolitan areas, two demographics that tend to predict where the industry at large is headed. Non-alcoholic beverages could make a debut in your deliveries in 2023, if they haven’t already. |
 | You’ll spend more time than ever thinking about social media.Social media is becoming the marketing channel that restaurants can’t ignore. In 2023, restaurants that never had Instagram accounts will get them; restaurants that never thought about TikTok will download it to see what the buzz is about. While search engines remain the number one source of new diners, social media is on the fast track to becoming a must-have digital property. |

1, 3, 5, 7. National Restaurant Association, “Restaurant Business Conditions Survey.” August 2022. 2. U.S. BLS, Series “CPIUFDSL” and “CES7000000011”, retrieved from FRED. 4. U.S. Bureau of Labor Statistics, “Current Employment Statistics.” 6 & 8. Popmenu, “58% of U.S. Consumers Are Dining Out More Often in 2022.” October 2022. 9. Restaurant Business, “At FSTEC, Restaurants Show That Technology Is No Longer A Luxury.” 20 Sept, 2022. 10. Assuming a 30% commission fee on third-party ordering. 11. Morning Consult, “Tracking the Return to Normal: Dining.” 22 June, 2022. 12. Google Trends. 13. BevAlc Insights, “Category on the Rise: Non-Alcoholic Wine, Beer, and Spirits.” 17 Oct, 2022.